Khoi Vinh, HTGT: What was your career ambition while you were at Rhode Island School of Design? Did you want to get a job at an agency or studio, or start your own agency or studio?
Nicholas Felton: RISD is not a school that focuses on what’s going to happen when you leave its doors. Everybody there was pretty focused on what’s due tomorrow and what’s due this week. I got to the end of my education, and that’s when I started going to portfolio reviews in New York and showing up with a really unrefined portfolio. There was good stuff in it, but it was in a paper bag. I would see people who had gone to schools that were really focused on job placement after graduation, and those people had beautiful portfolios and had a photographer shoot their work. That’s when I realized that I hadn’t really been thinking about what was next. I was very short-sighted about doing well in school and pursuing the ideas I had there.

Was that discouraging to get that bit of cold water splashed in your face?
[Laughs] I remember going to a portfolio review and having a good conversation with someone from Martha Stewart Living who liked my work. But my final project at RISD had been all about making artifacts from the book Catch 22, so I had made my own camouflage and a war-timey stencil typeface. He thought the work was great, but said, "We have no place for you at Martha Stewart." That was a glimmer of hope.
After working at an agency, DeMassimo, you started to produce your now-famous annual reports?
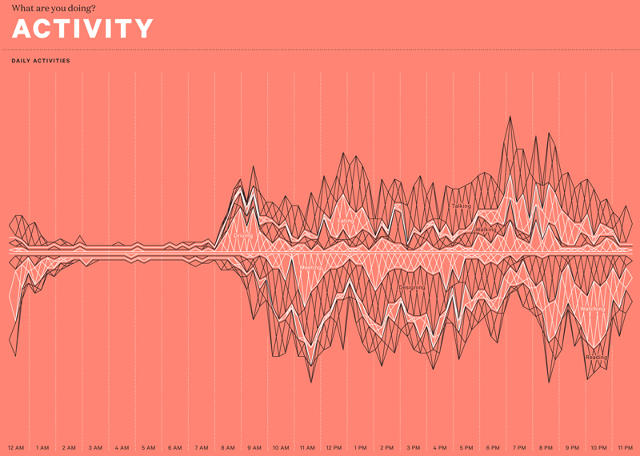
The first full annual report, which was about 2005, was something I thought that just a few people who knew me personally would find interesting. It was surprising that it spread around
the Internet and strangers found it intriguing.
When did you realize people would be willing to pay for it?
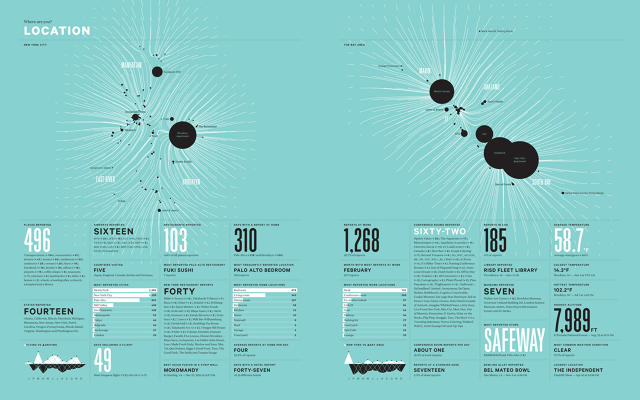
The first time I charged was 2007, at five dollars a piece, strictly as an experiment to see whether I could recoup some of the printing costs. That was a great success. I think I printed 2,000 copies—I held onto some for myself, but otherwise I sold all the ones that I had available. That’s the moment when I learned, if more people are willing to pay for it, then the more elaborate it could become, both in terms of printing and the time that I dedicate to it. Although I’ve never been very good at managing that balance. I always seem to break even.
Was that an eye-opening moment for you?
Yes, and it was about that time, in 2007 or early 2008, that I saw how robust this world of working with data was. I was starting to see it everywhere and realizing that the best way to become better with this medium was to start taking jobs that had their root in it.
I got editorial commissions, and at first they just wanted me to apply some nice typography to their charts and graphs. But these projects started getting more and more elaborate, giving me less and less direction. It moved to the point of "Here’s some data, what stories can you tell from it?" Those were the most interesting editorial assignments. I’m not sure how long it took to be able to move over to strictly doing data projects, but it was the best way to get better at it and it really keyed into this annual report being a self-promotional tool and a research-and-development playground for it.
You had your design practice, but then your reputation suddenly became synonymous with information visualization and you decided to build a business around that. Could you describe starting Daytum?
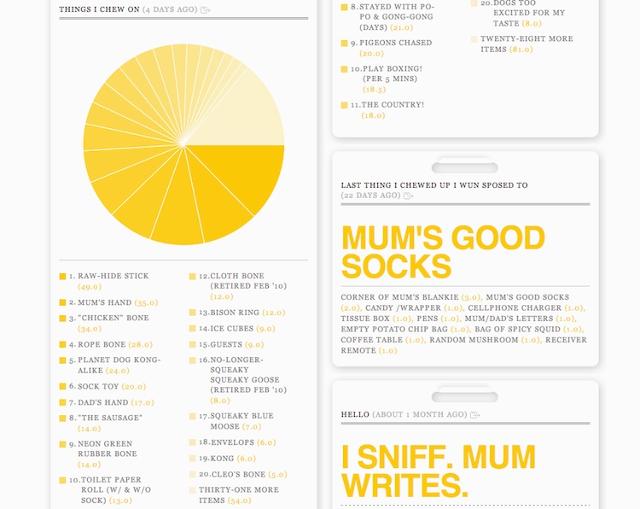
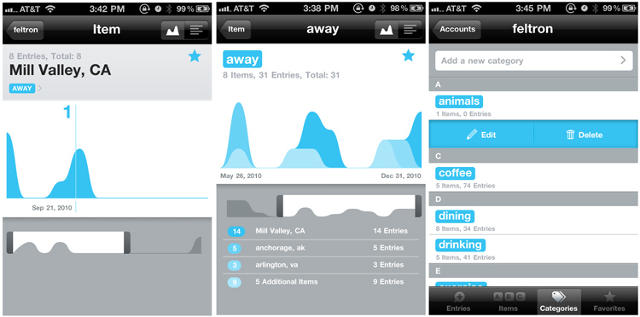
That idea primarily came from my friend and partner Ryan Case, who I’d been sharing the same office with. One day soon after releasing the 2008 report, he said, "Hey, what if we made an app that would allow people to visualize some of their data?" The initial idea was, "Let’s make a skin for Last.fm, where you could plug it in and visualize some of your music." That quickly turned into wanting the functionality where you could count the sort of stuff that I was collecting in the annual reports, such as how many miles you ran or what books you read or how many beers you drank. That led us closer to the idea of democratizing the tools behind the annual report. It’s hard to gather this data and it’s hard to analyze it and make it presentable. So we wanted to give people access to this kind of shorthand in a single system where they could both count and communicate with stuff that they cared about.
What happened when Facebook came calling?
I got a message from Mark Zuckerberg, saying, "I know you guys are working on a startup, but I would love to talk to you." It’s not the kind of invitation that you turn down. A couple months later, Ryan and I went out to California for some meetings about Daytum and about starting this pursuit of getting funding so we could work on it full-time. We went and talked to Mark and found out they were working on Timeline. We were especially interested in Open Graph, which was basically the ability to plug anything into Facebook. This included data sources that we were pretty interested in, like music, being able to visualize what you were listening to, or things that you’re watching from Netflix. At that point, the question for us was, "Do we want to work on Daytum and try and bring it to a grand scale, or have even a tiny influence on what 600 or 700 million people are using?" That was a hard conversation.
Were you excited by the Facebook path or was it painful to put
Daytum on hold?
We had a really strong vision for Daytum and I think we were hoping that we could bring a lot of that to Facebook, and sometimes that seemed very viable. Once we had our first meeting, we were out and working at Facebook within two weeks. We just dove in and Timeline was going to be announced in four or five months after we started, so there really was no time to catch our breath or think twice about the decision we made.
You left two years into your four-year Facebook contract. Without getting into sensitive details, could you say why you left?
I could see the balance shift between the work that Facebook wanted me to do for them and the kind of projects I wanted to build or the things that I wanted to put out into the world. It was just amazing, and learning what went into building a company and a website that’s top of class was an enormous education. I’m really happy to have learned that, and I think it changed the trajectory of my career to the point where now products are the things that I tend to be building.
Prior to Facebook you had been doing services with products on the side, but now you’re focused on products, period?
There are a couple of products that I left Facebook wanting to build. The first was Reporter, and the next one is one that I’m starting work on right now. I think they both come out of the same root inspiration that led to Daytum and led to wanting to work on Timeline, which is seeing these vacuums in the world of how people relate to their personal data and not having enough control over understanding what’s there or in being able to express themselves through it. When I see these vacuums, I feel obliged to jump into them and try and build the products that will create the experiences or tools that I think need to exist.
What’s your career been like since leaving Facebook?
I left Facebook in April 2013 and I wanted to give myself some time off just to figure out what was going to be next. During that time I did some traveling and I did some little coding experiments, trying to build my chops in that realm. Then around the end of the year I decided Reporter needed to get out into the world, so I focused on that. I thought that by the end of the
year I would have a clear focus as to what was next, but then it came time to do the annual report, which this year is really just a monster and it’s taking a long time. This one is going to be the penultimate report. The next one will probably be the last.
Why is that?
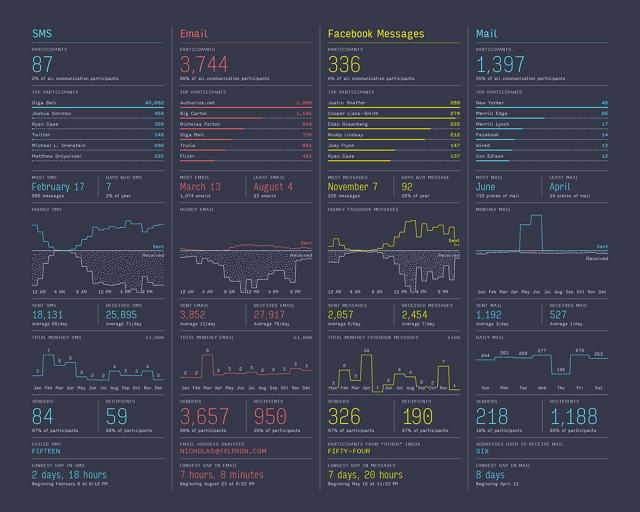
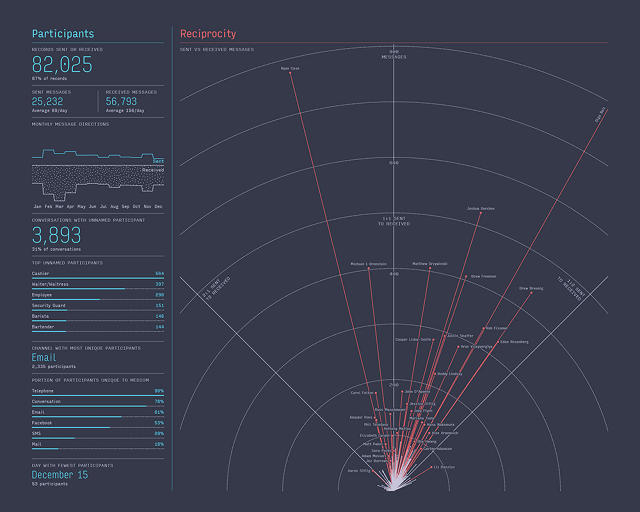
It’s too hard. The annual report is now more a piece of software than a piece of print. There’s an enormous database that underlies it. There are probably 20 processing apps that are feeding into it. It’s like a multidimensional creature that’s really hard to flatten into a static two-dimensional form. That’s a challenge that just gets harder and harder every year. Especially this one, the theme is communication and so I can tell this really rich story of my communication with my girlfriend, but that’s a private story. It’s not one that I want to communicate to the rest of the world. How do I find this middle path that talks about the kind of overwhelming world of communication we live in without violating people’s privacy or violating secrets or NDAs that all encumber the communication we have these days?
When you look ahead, with this ongoing project that’s going to come to an end, and you’re working on some new products that are very young, what do you see in your future? Do you think about what you’re going to be doing in two, five, or ten years?
I don’t know. I think working with data is almost a little fraught, because when I started with it, it looked like "sky’s the limit," and I saw it from a very personal angle. Now, if you generate data, the first question to ask about it is, "How is this data going to be used against you?" While I’m still fighting the fight to show the narrative potential of data, there is a real shadow over it. I’m not sure where we land if the value added by having access to your data or having the data saved is greater than the potential damage that that data can create in the wrong hands. That’s something I wrestle with at the moment.